

NATIONAL STATISTICS
You can use the data below as evidence for why the Day is needed at your institution. These are national numbers, so try to include figures specific to your campus as well. We’ve provided some suggestions for how you can use these numbers when making your case for the Day.

The numbers are growing.
The momentum is there.
We should remove barriers to political participation because it’s the right thing to do. Higher voter turnout rates will also bring positive attention to your institution, though. Day On Democracy provides an opportunity for your university to transcend the average voting rate and demonstrate its commitment to civic engagement. The Day helps universities build upon existing momentum, by allowing students to spend the day using their voice and helping others.

Registered? Check. Voting?
Not quite.
While the percentage of registered students is high, the actual turnout of registered students is low. The Day will enable these registered students to get to the polls, get their friends to the polls, and get out the vote!
Everyone contributes to democracy.
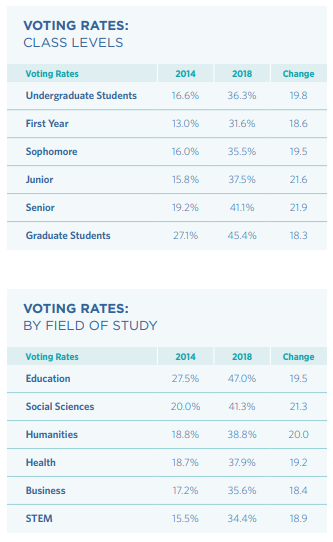
Researchers have recorded an increase in voting rates across all disciplines since 2016, but some fields of study consistently lag behind others. You can use these data to strengthen your argument if you’re pushing for Model 1, since that model emphasizes that cancellation of lab courses is important to the engagement of STEM students. You can also use voting rates by discipline to highlight areas of need that the Day would service.
In general, students turnout at higher rates as they progress in their undergraduate careers. Day On Democracy can help address the participation gap among first-year students through strategic program design. Professors and administrators might, for instance, link the Day and its lead-up activities to the Freshman Experience at your institution. A positive voting experience in the first, exciting year of college goes a long way toward creating a lifelong voting habit.
Updated 2019. All photos courtesy of Thomas, N., Gismondi, A., Gautam, P., & Brinker, D. (2019). Democracy Counts 2018: An Analysis of Student Participation. Institute for Democracy & Higher Education, Tufts University’s Jonathan M. Tisch College of Civic Life.